Simple Moving Average
A simple moving average is formulated by adding up the last X number of market days’ closing prices and dividing that total by X.
For example, if you wanted to calculate a stock XYZ’s 3 day simple moving average. You would add up 3 day’s closing prices. Let’s say XYZ’s closed at, 10, 11 and 12 the last 3 days. These prices added together equals 33. We then take that number an divide it by the number of days used, which is 3. So, you would plot 33/3 (= 11) over 3 days on the chart to show the moving average.
($10+$11+$12) / 3 = $11 (3-Day Simple Average Price)
You might be saying, “Okay, great I know how to calculate a simple moving average now. So what, my charting tool already does that!” Well, this way you should hopefully have a better understanding of how the SMA works and therefore have a greater ability to use it to help with your technical analysis.
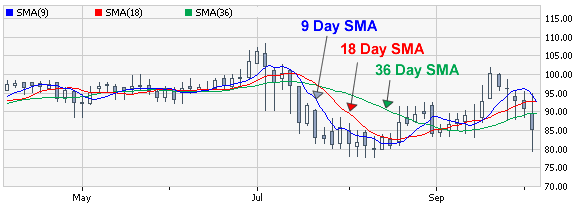
Simple Moving Average Example

The above chart shows 3 examples of simple moving averages. Obviously, the closer the time span gets to 0 days, the closer it represents the actual price chart, and the faster it responds to price trends. The opposite is also true, the greater the number of days used to calculate the SMA the less quickly it responds to the current price trend.
With looking at the simple moving average in the above chart, you will notice how it has the ability to quiet out some of the “market noise” and give you an easier way to predict future price movements.