Ascending Triangle Pattern
An ascending triangle forms when buyers push the lows higher against a flat ceiling of resistance. Usually bullish, and usually resolved by a breakout through that ceiling.
An ascending triangle forms when the lows march steadily higher while the highs stall at the same ceiling. The result is a flat line of resistance on top and a rising line of support underneath.
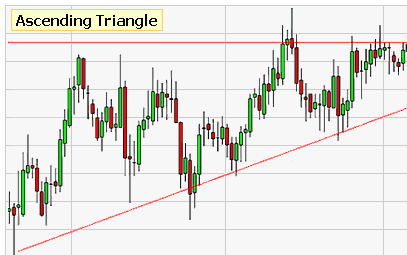
The story is fairly legible. Something is selling at a fixed price — a large holder working an order, or simply a level enough traders remember. Buyers keep stepping in earlier on each dip, which is why the lows rise. The ceiling stays put while the floor climbs toward it, so the supply at that level is being steadily absorbed while demand grows more urgent.
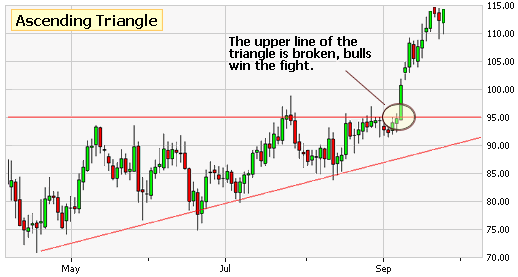
That asymmetry is why the pattern leans bullish. It is not a guarantee — the seller may be far larger than the buyers — but when the level finally gives, the sellers who were defending it are gone and there is often very little immediately above.
What Confirms It
The breakout needs volume. A close above resistance on heavy relative volume means the supply there was genuinely consumed. A drift above it on thin trade usually means the seller simply stepped away for an hour and will be back. On penny stocks the distinction is the entire trade: these are the setups that turn up on a 52-week breakout scan the day they resolve, and the ones that fail tend to fail immediately.
What to Watch For
- Flat resistance above, rising support below. Bullish lean.
- The flat ceiling is supply being absorbed; the rising floor is growing urgency.
- The breakout needs volume to confirm the supply was genuinely consumed.
- Failed breakouts tend to fail fast — the level should hold on a retest.
Scans That Use This
Chart Patterns
Trading guides on StockMarketWatch — the same material for large caps, with live data attached.