Double Top Pattern
A double top is two failed attempts at the same high with a dip between them. It says buyers tried twice and could not get through — a classic topping signal.
A double top is two attempts at roughly the same high with a pullback in between, forming an M. The message is simple: price got to a level, failed, came back, and failed again at the same place.
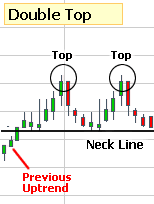
The second failure is what carries the information. The first tells you there are sellers there. The second tells you they are still there, and that the buyers who drove the first attempt have now been proven wrong twice. Traders who bought the first high are underwater and inclined to sell into any bounce.
The Neckline Is the Signal
The pattern is not confirmed at the second peak — it is confirmed when price breaks below the trough between the two peaks. That low is the neckline. Until it goes, what you have is a stock that stalled twice, which happens constantly and resolves upward often enough to be dangerous to trade early.
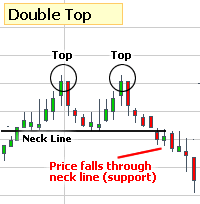
The two peaks do not need to match to the cent; within a few percent is normal, and on a volatile sub-$5 stock the tolerance is wider still. What matters more is volume: the second push should arrive on visibly less volume than the first. That fading participation is the pattern’s real tell, and without it you may simply be looking at consolidation below resistance.
What to Watch For
- Two failed pushes at one level, forming an M.
- Confirmed by the break below the trough between the peaks, not at the second peak.
- The second push should come on lighter volume than the first.
- Peaks within a few percent of each other are close enough.
Scans That Use This
Chart Patterns
Trading guides on StockMarketWatch — the same material for large caps, with live data attached.