Double Bottom Pattern
A double bottom is two tests of the same low that both hold, forming a W. It says sellers tried twice and could not break the floor — a classic bottoming signal.
A double bottom is the mirror image: two tests of about the same low that both hold, with a bounce between them, forming a W.
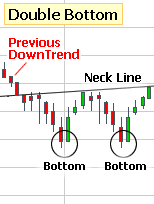
Sellers pushed price down to a level, buyers absorbed it, sellers tried again, and buyers absorbed it again. The second hold is the evidence — it says the first was not luck. Whoever is buying at that price is still there and still willing.
Confirmation and the Penny Stock Caveat
As with the double top, the pattern confirms on the neckline — here, the peak of the bounce between the two lows. A break up through that level completes it. Volume should build on the second low and expand on the break.
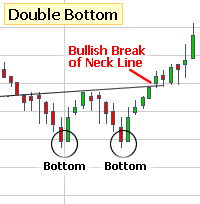
One caution specific to this end of the market. A double bottom assumes the floor is demand. On a penny stock it can instead be a mechanical artifact — a conversion price in a toxic financing deal, for instance, where a holder is converting and selling at a fixed level. That produces a very convincing flat floor that breaks the moment the tranche is done. If a sub-$1 stock keeps bouncing off a precise round number, read the filings before you trust the shape.
What to Watch For
- Two holds at one level, forming a W.
- Confirmed by the break above the peak between the two lows.
- Volume should build on the second low and expand on the break.
- A precise round-number floor on a sub-$1 stock is worth checking the filings for.
Scans That Use This
Chart Patterns
Trading guides on StockMarketWatch — the same material for large caps, with live data attached.