Stochastics
Stochastics measures where price closed within its recent range. Fast versus slow, overbought versus oversold, and why the reading lies in a strong trend.
The stochastic oscillator asks one narrow question: where did price close within its recent range? A reading near 100 means it closed near the top of that range, near 0 means near the bottom. The premise is that strength tends to close high and weakness tends to close low.
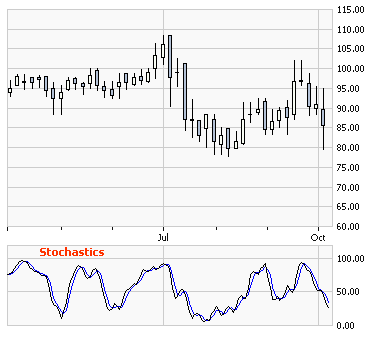
Fast and Slow
Two lines. %K is the raw calculation; %D is a short moving average of %K, used as the signal line. The fast stochastic plots them directly and is extremely jumpy. The slow stochastic smooths both, trading a little lag for far fewer false signals — which is why most traders use it.
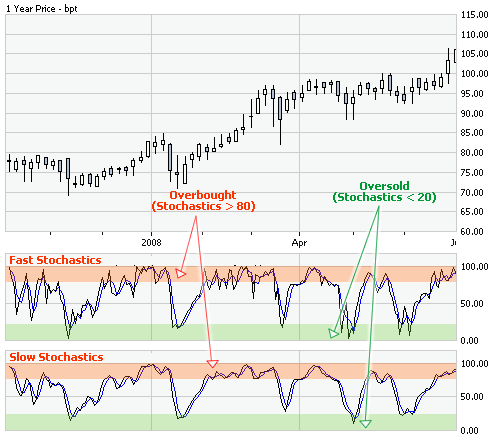
Readings and Divergence
Above 80 is conventionally overbought, below 20 oversold. Crossovers of %K through %D inside those zones are the standard trigger. The more durable signal is divergence: price making a lower low while the oscillator makes a higher low says the selling is losing force even though price has not turned.
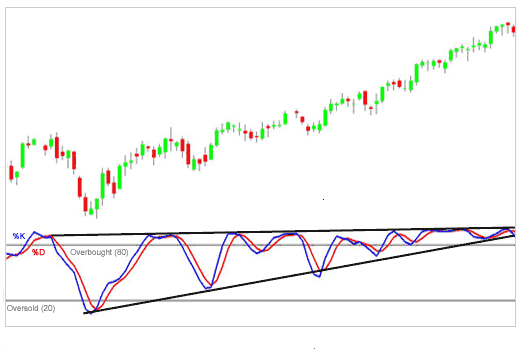
The Trap
Overbought does not mean sell. In a strong move the stochastic pins above 80 and stays there for the entire run, and every crossover looks like a top. This is the same failure mode as the Bollinger walk, and for the same underlying reason: range-based indicators assume a range exists.
On a penny stock with a catalyst, the recent range is obliterated in minutes and the oscillator saturates immediately. Use it for mean-reversion candidates — which is what our oversold scan screens for — and distrust it on anything already running.
What to Watch For
- Measures where price closed within its recent range, 0 to 100.
- Slow stochastic smooths the noise; most traders prefer it to fast.
- Divergence is more durable than a raw overbought or oversold reading.
- In a strong move the oscillator pins above 80 and stays there — overbought is not a sell.
Scans That Use This
Technical Indicators
- Bollinger Bands
- Stochastics
Trading guides on StockMarketWatch — the same material for large caps, with live data attached.