Descending Triangle Pattern
A descending triangle forms when sellers push the highs lower against a flat floor of support. Usually bearish, and usually resolved by a breakdown through that floor.
A descending triangle is the ascending triangle inverted. The highs step steadily lower while the lows hold at one flat level, giving a falling ceiling above a fixed floor.
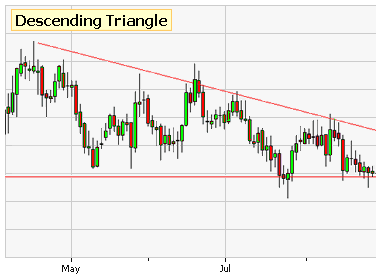
Here a buyer is defending a price — a standing bid, or a level that looks like value to enough people. But sellers accept less on every bounce, so the highs fall. Each test of the floor arrives with less buying enthusiasm behind it, and the defended bid is worn down.
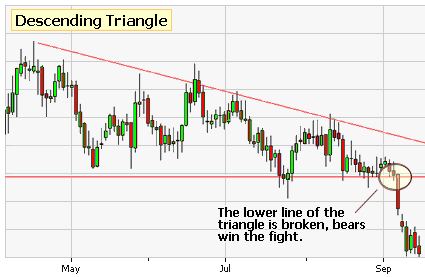
The pattern leans bearish, and the break tends to be quick, because the traders who were buying at that floor are usually stopping out into the same move that broke it.
The Exception Worth Knowing
A descending triangle at the bottom of an extended decline is a different animal from one at the top of a rally. After a long fall, that flat floor may be genuine accumulation rather than a doomed defence, and these sometimes resolve upward instead.
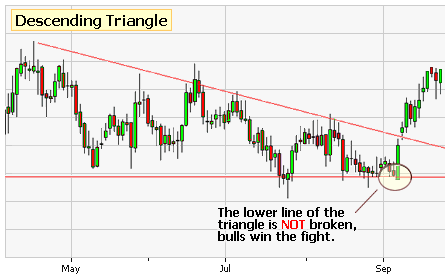
Check where the pattern sits before assuming direction: near a 52-week low it deserves more suspicion than near a high. And on a penny stock, a flat floor that never once wobbles is worth questioning — genuine support is rarely that tidy.
What to Watch For
- Falling resistance above, flat support below. Bearish lean.
- Breaks tend to be quick, because buyers at the floor stop out into the same move.
- After an extended decline it can resolve upward instead — position matters.
- A floor that never wobbles on a penny stock may be mechanical, not demand.
Scans That Use This
Chart Patterns
Trading guides on StockMarketWatch — the same material for large caps, with live data attached.