Relative Strength Indicator (RSI)
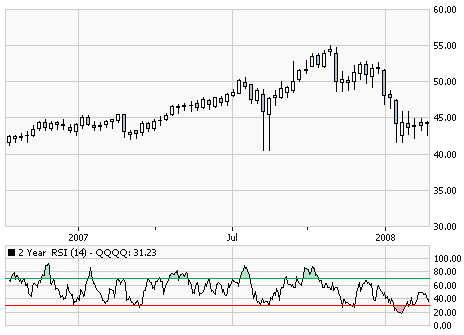
The RSI or Relative Strength Index is a technical indicator used to find when a stock has been oversold or overbought. The RSI is usually plotted below the chart and its number always ranges from 0 to 100.

As you can see from the chart above the RSI is highlighted when it is above 80 and when it is below 20. The reason for this is that these are two important areas for the RSI. Any move below 20 on the RSI is a sign that the stock is oversold and may rebound soon. Any move above 80 is a sign that the stock is overbought and may fall in price soon.
RSI Overbought
When the RSI goes under 20 and then reverses and continues back up past to 40-50 range this is usually a strong sign that the stock is going to recover well from its recent oversold status and price drop. A move above 20 is sometimes known as a soft buy signal and a move back up over 50 is sometimes known as a strong or hard buy signal. However, if you wait for the 50, you could also be too late to ride the wave back up. Be sure to research well and time your trade better.
RSI Oversold
When the RSI goes above 80 and then reverses and continues to drop under 50, this is usually a strong sign that the stock is going to fall back down from its recent overbought status and price jump. A move back below 80 is sometimes known as a soft sell signal and if the fall continues down through 50 this is sometimes known as a strong or hard sell signal.